
These examples show how a fictional company used eiso features to find materials, create management system documents, keep operational records and provide on-site training, by industry, standard and size. The topic (angle) of the case changes every day, and there are 12 in all.
Finding evidence through information collection · Building a document system from scratch · Creating one procedure · Improving quality with writing instructions and reference materials · Related forms and writing examples · Refining documents with completeness check results · Integrating documents for each standard into one · Revising documents for a new edition · Running a year with the 20 operation steps (two tracks) · Correcting nonconformities · Training materials to bring documents to the workplace · One flow from establishment to operation.
Each article includes what was entered in each field on screen, a preview of the output, tips for better results and "Check your own company too", so you can follow along as is. Below you can select by standard, size and industry.
- Cases are written by AI based on the day's topics (standard revision schedules, anniversaries, weekday themes) and the management system materials compiled by AGENT, and are posted after review by AGENT staff.
- Company and personal names are fictional, borrowed from historical figures, and have no relation to any real company or certification audit. Figures are examples; please check standard clauses and laws against the original text.
- AGENT only helps you write documents with AI AX and does not guarantee certification results. Refining documents to a level that can be certified is your company's responsibility. The documents in the cases are depicted as created by the company itself with eiso features and reviewed and approved by the company.
- To decide where to start, see the Management System Establishment Guide and the Management System Operation Guide; for what the output looks like, see the Management System Establishment and Management System Operation examples.
Hanbit Autotech Co., Ltd. (fictional): IATF 16949 PFMEA → control plan → MSA → SPC → 8D: fixing bolt-hole tool wear in one loop
The company linked the PFMEA and control plan for a brake caliper bracket bolt hole (CC) by the same numbers, confirmed the gauge with MSA (%GRR 5.68%), caught a tool-wear trend on the X̄-R chart and fixed it with an 8D. After improvement Cpk rose from 1.16 to 1.91 and the PFMEA and control plan were revised. A fictional case for training.
This case is a fictional scenario for training purposes. The company, product and figures are made up, and the measurements were generated with a fixed random seed.
Today’s situation
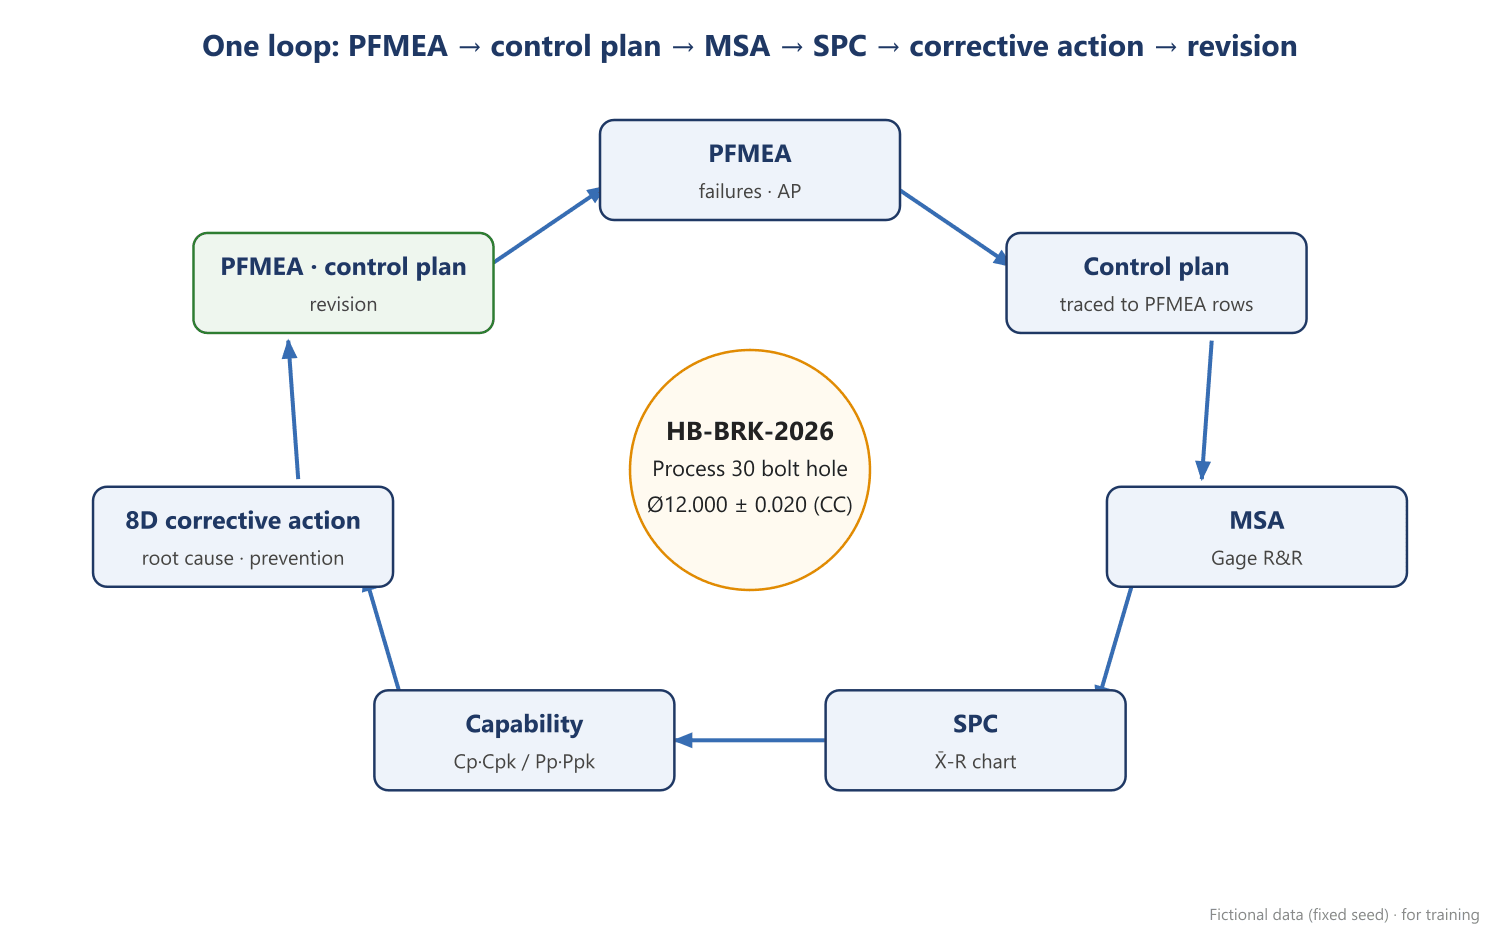
Angle of this case: running the Core Tools as one flow, from PFMEA through the control plan, MSA and SPC to corrective action and document revision
- Hanbit Autotech Co., Ltd. (fictional) machines brake caliper brackets and is IATF 16949 certified. 180 people (example).
- The subject is process 30, bolt-hole machining (drill and ream) of bracket HB-BRK-2026. The bolt-hole diameter Ø12.000 ± 0.020 mm is a customer-designated CC (safety-related special characteristic), and the 0.05 position tolerance is an SC.
- PFMEA, control plan, MSA and SPC were kept separately by each department, so when the control chart showed something unusual, nobody could go straight to the PFMEA row and control plan item that had to change.
- The quality manager led the work. The goal was to link the five tools with the same numbers and, when something goes wrong, go all the way round to document revision.
Step 1: PFMEA (AIAG-VDA seven steps)
- The team worked through 1 planning and preparation (scope: process 30) → 2 structure analysis (process steps, 4M work elements) → 3 function analysis (the functions that produce diameter and position) → 4 failure analysis (effect, mode and cause chain) → 5 risk analysis (S·O·D and AP) → 6 optimization → 7 results documentation.
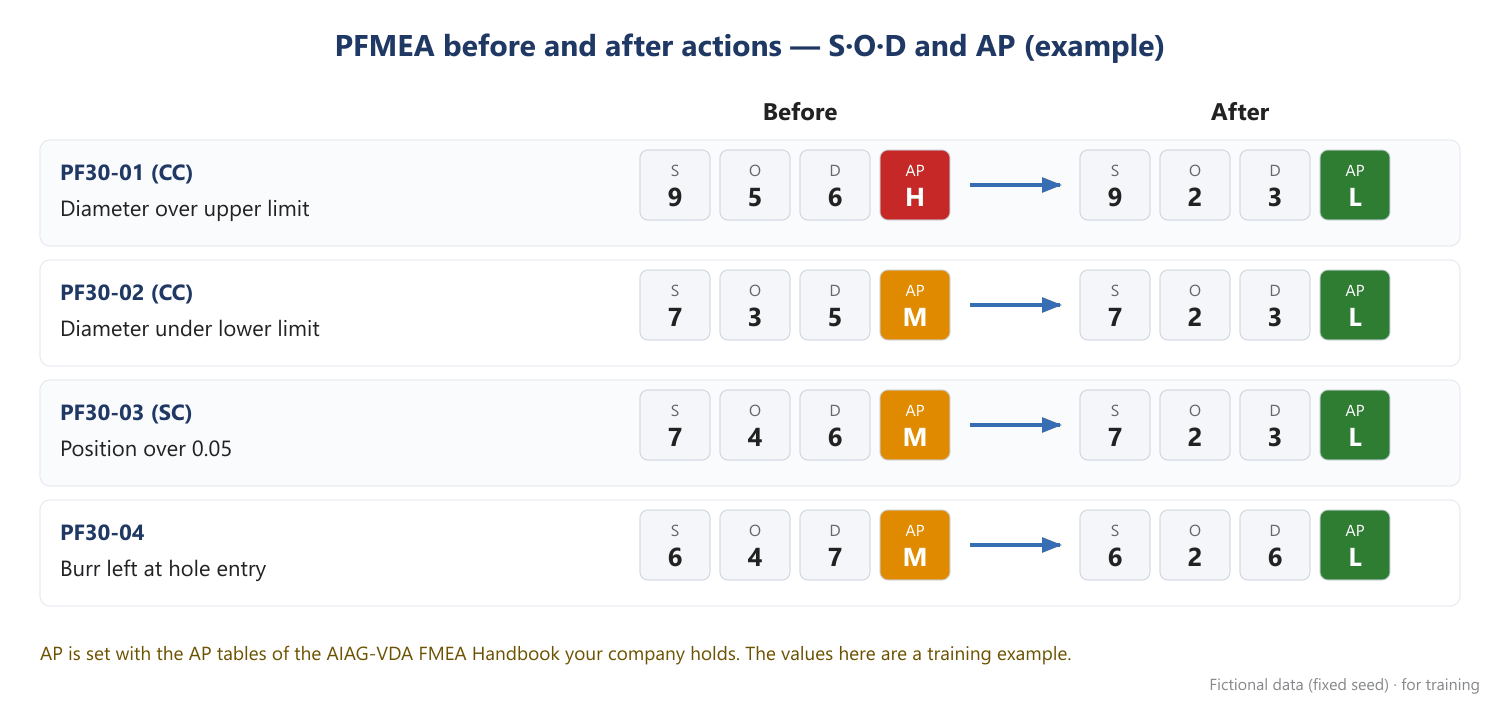
- Results of steps 4 and 5 are below. AP was set with the AP tables of the AIAG-VDA FMEA Handbook the company holds (the tables are not reproduced here; values are an example).
| PFMEA row | Failure mode | Special char. | Failure cause | S | O | D | AP |
|---|---|---|---|---|---|---|---|
| PF30-01 | Diameter over upper limit | CC | Reamer wear (no replacement rule) | 9 | 5 | 6 | H |
| PF30-02 | Diameter under lower limit | CC | Wrong offset entered after tool change | 7 | 3 | 5 | M |
| PF30-03 | Position over 0.05 | SC | Chips caught on fixture datum | 7 | 4 | 6 | M |
| PF30-04 | Burr left at hole entry | Drill wear | 6 | 4 | 7 | M |
- PF30-01 is AP H, so action is required. The planned action (tool-life control) was confirmed after the 8D checked the evidence (step 6).
Step 2: Control plan (traced to PFMEA rows)
- Every control plan characteristic carries its PFMEA row number, so you can trace back which failure cause each control is meant to stop.
| Char. no. | Characteristic | Special char. | Measurement | Sample, frequency (Rev.2) | Control method | PFMEA row |
|---|---|---|---|---|---|---|
| CP30-01 | Bolt-hole diameter Ø12.000±0.020 | CC | Air gauge | 5 pcs every 2 hours | X̄-R chart | PF30-01, 02 |
| CP30-02 | Position 0.05 | SC | CMM | 1 pc per shift | Measurement record | PF30-03 |
| CP30-05 | Burr at hole entry | Visual | 5 pcs every 2 hours | Check sheet | PF30-04 |
Step 3: MSA (Gage R&R, ANOVA)
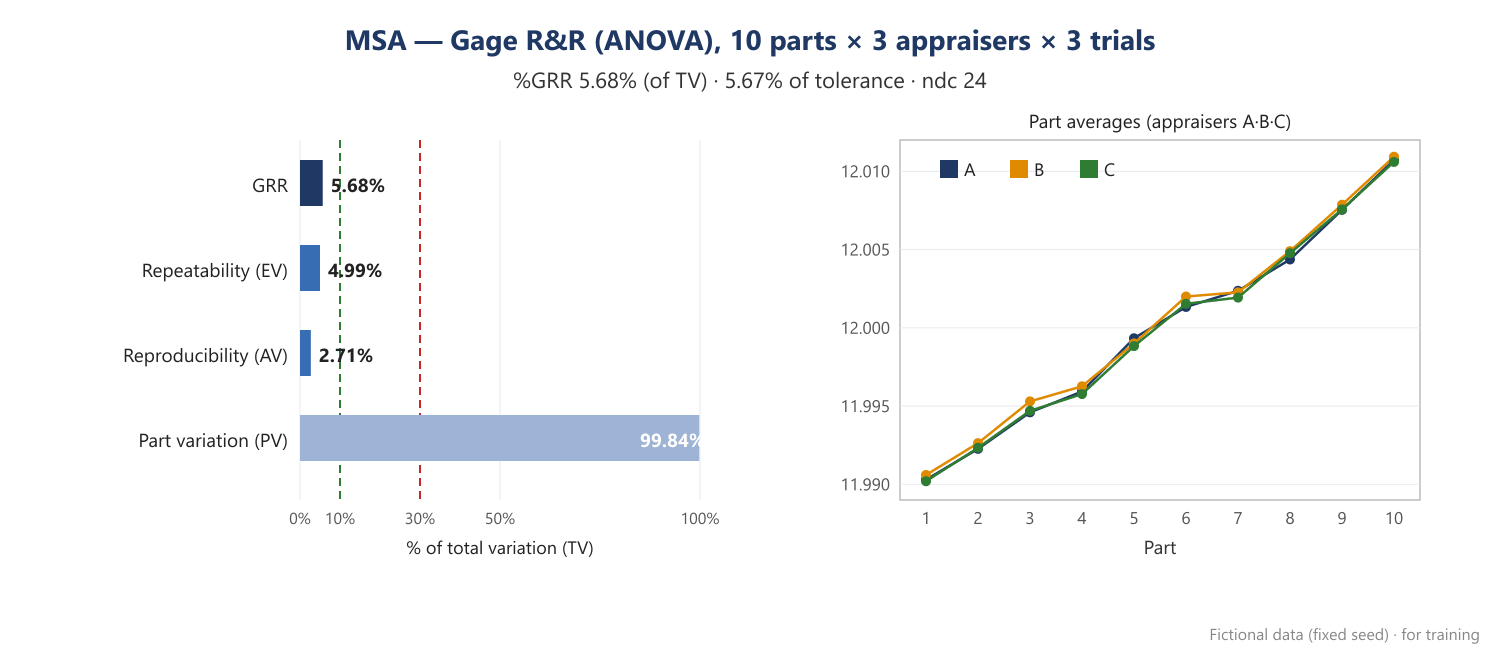
- Before you can trust a control chart you must trust the measurement. The air gauge was studied with 10 parts × 3 appraisers × 3 trials and the variation split by ANOVA.
- The part × appraiser interaction had p = 0.603, not significant, so it was pooled into repeatability.
- Result: %GRR 5.68% of total variation (5.67% of tolerance), repeatability 4.99%, reproducibility 2.71%, ndc 24. It met the criteria (%GRR under 10%, ndc 5 or more), so the measurement system was accepted.
Step 4: SPC (X̄-R chart)
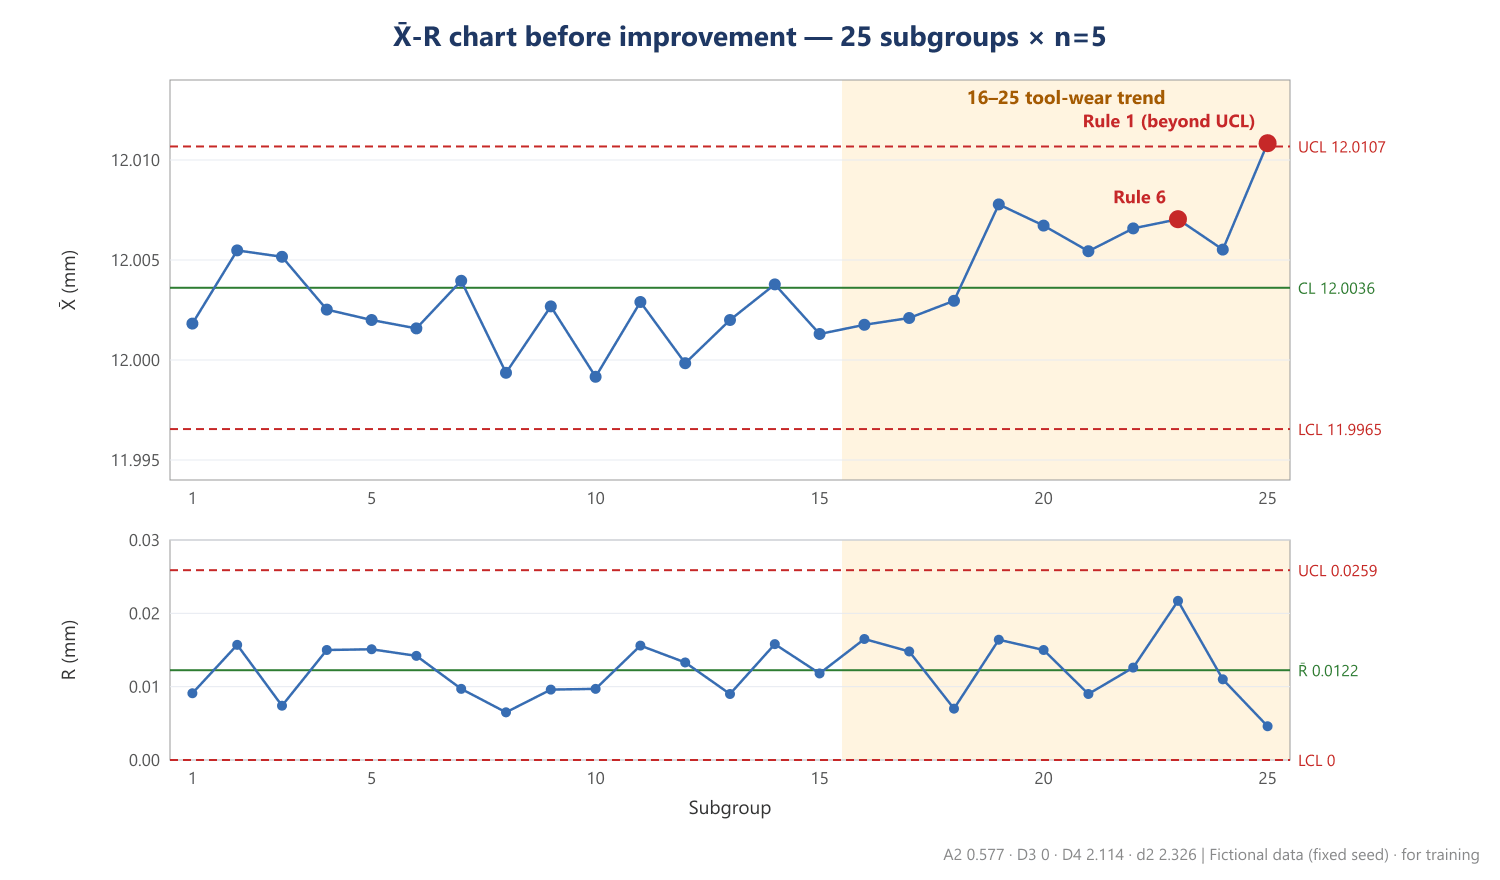
- Five parts every 2 hours gave 25 subgroups. Constants for subgroup size 5: A2 0.577, D3 0, D4 2.114, d2 2.326.
- X̄̄ 12.0036, R̄ 0.0122 → X̄ chart UCL 12.0107 and LCL 11.9965; R chart UCL 0.0259 and LCL 0.
- Out-of-control rules (Nelson 1–6, 9 points in a row on one side, 6 points rising or falling) were checked automatically.
- Subgroup 23: rule 6 (4 of 5 points beyond 1σ on the same side), a warning.
- Subgroup 25: rule 1 (beyond UCL), out of control.
- Subgroups 1–15 show no signal, and the R chart has no point out of limits. The spread stays the same while the mean keeps rising, so this was read as a tool-wear trend in subgroups 16–25.
- No part was out of specification (largest value 12.0184 mm). Going out of control is an early warning while parts are still within specification.
Step 5: Capability, Cp·Cpk versus Pp·Ppk
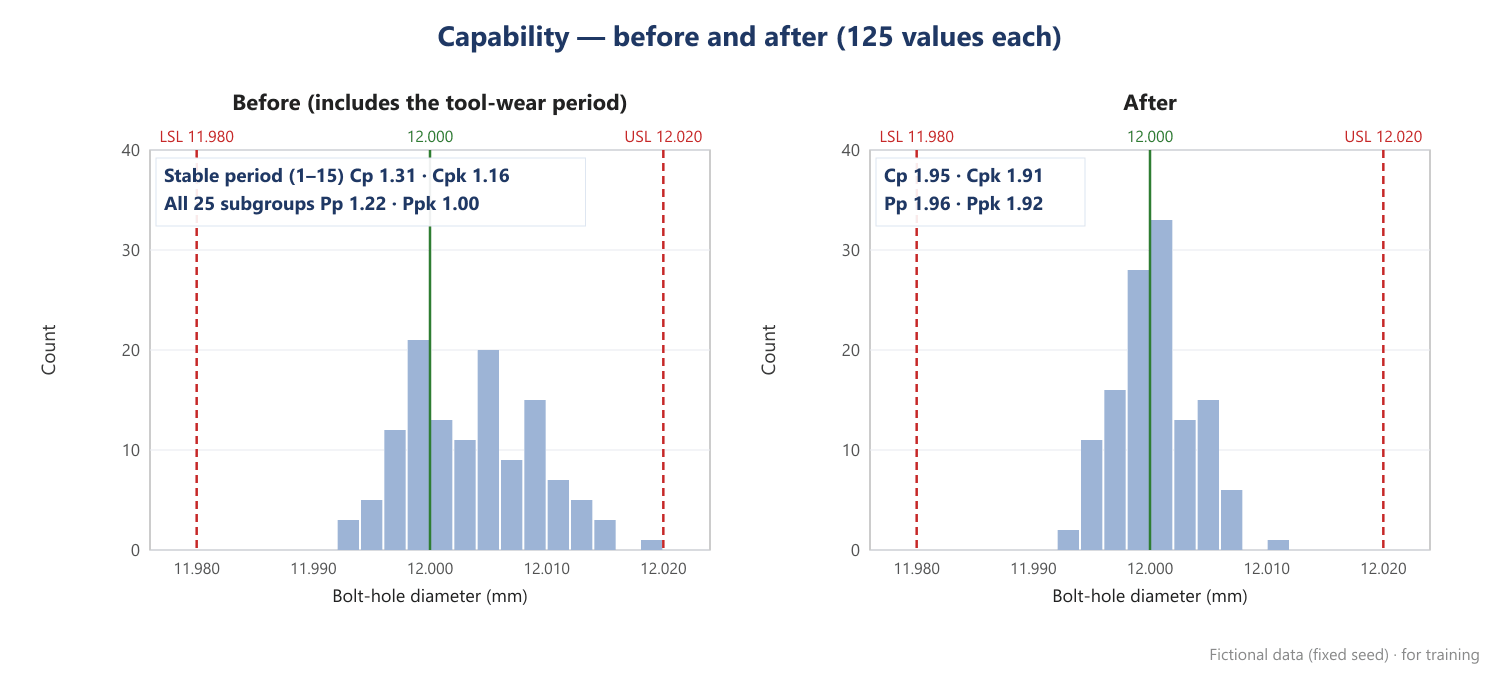
- Cp and Cpk use the stable period (subgroups 1–15) with within-subgroup σ (R̄/d2 = 0.0051): Cp 1.31, Cpk 1.16.
- Pp and Ppk use all 25 subgroups with the sample standard deviation (0.0055): Pp 1.22, Ppk 1.00.
- Ppk is lower than Cpk because the wear trend widened the overall spread. Even the stable period reached only Cpk 1.16, below the 1.33 target, so removing the trend alone would not be enough. For a process that is not stable, judge with Pp and Ppk rather than Cpk.
Step 6: 8D corrective action
- D1 Team: quality manager (lead), production supervisor, tooling, maintenance and the metrology room.
- D2 Problem: CC diameter X̄ chart out of control at subgroup 25, rising mean over 16–25.
- D3 Containment: machine stopped, output since subgroup 16 quarantined and 100% measured (0 out of specification, example), reamer replaced, restart after the first 3 parts were measured and approved.
- D4 Root cause: occurrence, no reamer replacement rule, so operators changed it by experience (about 2,300 parts on average, example). Escape, the control chart was only recorded and the rules were not checked, with a 2-hour measuring interval.
- D5 Permanent action: replace tools every 1,500 parts (counter lock) with a wear offset, automatic rule checking, 5 parts every 50, automatic air blow and a seating sensor on the fixture (error-proofing).
- D6 Verification: checked with 25 subgroups after the actions (step 7 below).
- D7 Prevent recurrence: PFMEA and control plan revised, work instruction and set-up verification checklist revised, rolled out to process 40, which uses the same reamer.
- D8 Closure: reported at management review, and tool-life compliance added to the objective indicators.
Step 7: Confirmation after improvement (25 subgroups)
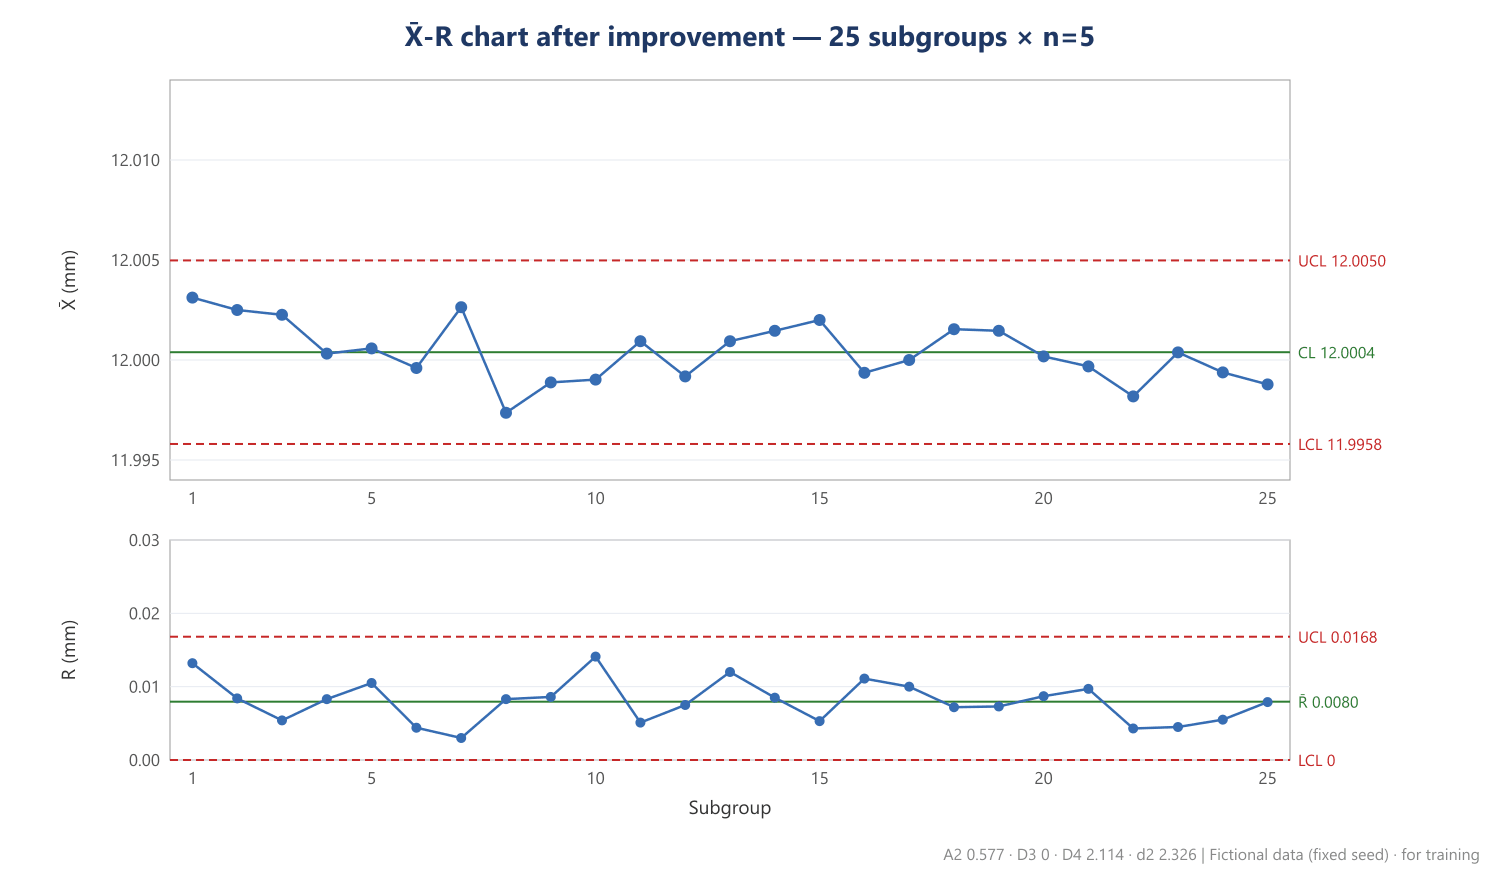
- X̄̄ 12.0004, R̄ 0.0080 → UCL 12.0050 and LCL 11.9958; R chart UCL 0.0168. No rule signals.
- Cp 1.95, Cpk 1.91 (Pp 1.96, Ppk 1.92), above the Cpk target of 1.33.
Step 8: Revising the PFMEA and control plan
- The PFMEA step 6 optimization results were entered and O and D re-rated. AP moved from H 1 and M 3 to L 4 (example).
- The control plan went from Rev.2 to Rev.3.
- CP30-01: frequency every 2 hours → 5 parts every 50, control method "record" → rule checking, reaction plan "stop the machine, quarantine and 100% measure output since the last check, inspect the tool".
- New CP30-03: reamer and drill life 1,500 parts (machining counter, every cycle) → PF30-01, 04.
- New CP30-04: fixture seating sensor (100%, error-proofing) → PF30-03.
- So one signal went from the PFMEA row → control plan item → measurement → control chart → corrective action and back to the PFMEA, completing the loop.
Related clauses (number and gist)
- IATF 16949:2016: 8.3.3.3 special characteristics, 8.5.1.1 control plan, 7.1.5.1.1 measurement systems analysis, 9.1.1.1 monitoring and measuring manufacturing processes (process studies), 9.1.1.2 identifying statistical tools, 10.2.3 problem solving, 10.2.4 error-proofing, 8.5.1.3 job set-up verification. Check clause titles and requirement wording against the copy of the standard your company holds. eiso does not carry the text of standards.
- Manuals used: AIAG-VDA FMEA Handbook, AIAG Control Plan 1st edition (2024), MSA 4th edition, AIAG & VDA SPC 1st edition (2026). Where customer-specific requirements (CSR) set the criteria (%GRR, ndc, Cpk), they come first.
Do it this way on eiso
IATF 16949 Core Tools run on top of the Company Workspace and Operational Data Management, and open for products whose operating standard is set to IATF 16949 in the product master. Writing is unlocked by the workspace administrator’s IATF 16949 operations pass.
- Tabs: dashboard, design phase (A1–A13), manufacturing phase (B1–B7), traceability and settings.
- A4·A7 FMEA: enter the failure chain and S·O·D, and AP and RPN (for reference) are calculated. The AP lookup tables are entered in settings by your company from the handbook it holds; eiso does not include them.
- A8·A9 Control plan: draft the control plan from the PFMEA and link each characteristic to its FMEA row, gauge, chart type and sample size; it continues into B1 production control plan.
- A10 initial MSA and B3 periodic MSA: Gage R&R by average-and-range or ANOVA, type 1 study, bias, linearity, stability and attribute agreement. Default criteria are %GRR 10% and 30% and ndc 5, changeable in settings. When a measurement system fails, control plans that use that gauge are marked "review needed".
- B2 SPC: X̄-R, I-MR, EWMA and CUSUM charts with out-of-control rules (default Nelson 1–6, 9 in a row, 6-point trend, changeable in settings) and capability (default production Cpk 1.33; judged by Ppk when the process is not stable).
- B5 change management and B6·B7 updates and feedback: when a change request is approved, or a customer complaint or closed corrective action arises in Operational Data Management, the linked control plans and FMEAs are marked "review needed". The traceability tab shows which FMEA rows, control plan items and MSA a special characteristic is linked to.
- Write the 8D report on the customer response tab of Operational Data Management, linked to a customer claim or a nonconforming product, and keep the record from cause analysis to closure approval in the Nonconformity and Corrective Action Register.
- Calculations and verdicts are for reference; the final decision is your company’s. Approved documents are never edited in place but replaced by a new version, and the history is kept.
Check your own company
- □ Every PFMEA row has S·O·D and AP, and each AP H has an action, owner and due date
- □ Every control plan characteristic shows its PFMEA row number
- □ CC and SC use the same symbols on the drawing, PFMEA and control plan
- □ Every gauge in the control plan has MSA results (%GRR, ndc)
- □ Control chart rules and the reaction plan (who does what) are defined
- □ Process characteristics such as tool life and set-up verification are in the control plan
- □ Cpk is read on a stable period and Pp·Ppk on all data, separately
- □ The 8D records the root cause split into occurrence and escape
- □ Effectiveness is verified with enough subgroups (for example 25) and recorded
- □ After corrective action, the PFMEA and control plan are revised and the fix rolled out
Cost
Prices are TBA on the English site. Operations passes are issued per standard, and IATF 16949 Core Tools are used within that pass. See eiso Pricing.
See also
※ This article is an example written by AI around a fictional company to introduce eiso features, then checked and posted by the Agent staff. Company and person names are fictional placeholders and have nothing to do with any real company or certification audit. The figures are examples; please check standard clauses and legislation against the original texts. The Agent prepares documents with AI AX and does not guarantee certification results. Developing the documents to a certifiable level is your company's role.
